##Input \& play audio
```
[inputAudio, Fs] = audioread('觉醒年代主题.wav');
% reads an audio file using the 'audioread' function
% returns two outputs: [inputAudio, Fs]
% inputAudio, which is a matrix containing the audio samples for each channel
% Fs, which represents the sampling rate of the audio.
% Play the audio
sound(inputAudio, Fs);
% runs the matirx stored in *inputAudio* using the 'sound' function
% and runs it at the specified sampling rate *Fs*.
```
##left and right channel signals
```
time = (0:length(inputAudio)-1)/Fs;
% a time vector time is created by dividing the index of each sample by the sampling rate Fs
% '-1' is subtracted from the result to ensure that the indices start from 0
% '(0:length(inputAudio)-1)' creates a vector of indices ranging from 0 to the total number of samples minus 1
% '/Fs' divides each index value by the sampling rate Fs
% As a result, `time` is a vector that represents the time (in seconds) at which each sample in the audio signal occurs.
```
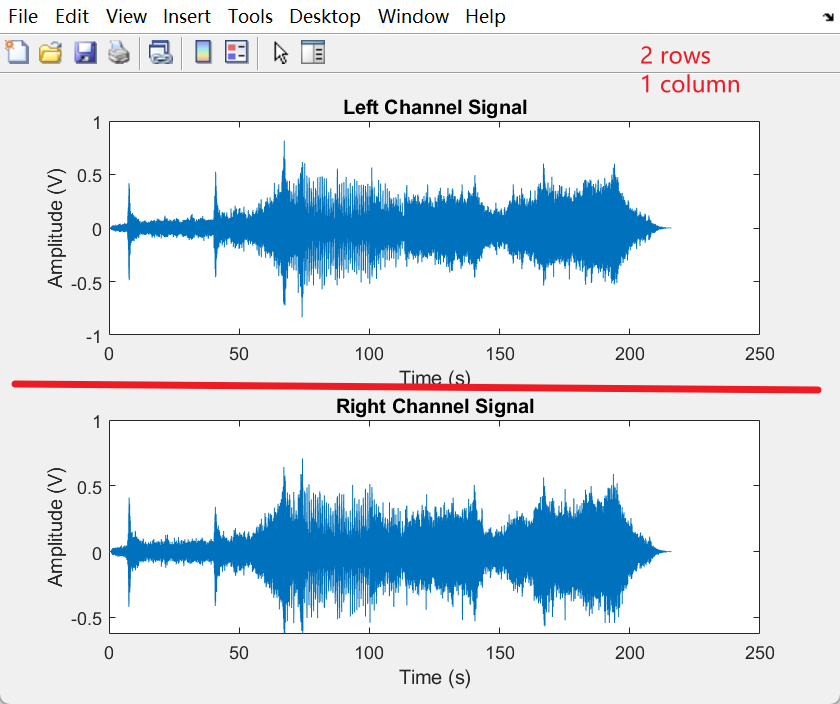
##subplot
\>allows the user to plot multiple graphs in a single figure
the subplot(2,1,1) call indicates that the figure window will be divided into 2 rows and 1 column, and the subsequent plot function will create a plot in the first "slot" of this grid
\>