上一篇我们介绍了如何监控Kube-Proxy,Kube-Proxy的/metrics接口没有认证,相对比较容易,这一篇我们介绍一下Kubelet,Kubelet的监控相比Kube-Proxy增加了认证机制,相对更复杂一些。
Kubelet 端口说明
如果你有多台Node节点,可以批量执行 ss -tlnp|grep kubelet 看一下,Kubelet 监听两个固定端口(我的环境,你的环境可能不同),一个是10248,一个是10250,通过下面的命令可以知道,10248是健康检查的端口:
[root@tt-fc-dev01.nj ~]# ps aux|grep kubelet
root      163490  0.0  0.0  12136  1064 pts/1    S+   13:34   0:00 grep --color=auto kubelet
root      166673  3.2  1.0 3517060 81336 ?       Ssl  Aug16 4176:52 /usr/bin/kubelet --bootstrap-kubeconfig=/etc/kubernetes/bootstrap-kubelet.conf --kubeconfig=/etc/kubernetes/kubelet.conf --config=/var/lib/kubelet/config.yaml --hostname-override=10.206.0.16 --network-plugin=cni --pod-infra-container-image=registry.aliyuncs.com/google_containers/pause:3.6
[root@tt-fc-dev01.nj ~]# cat /var/lib/kubelet/config.yaml | grep 102
healthzPort: 10248
[root@tt-fc-dev01.nj ~]# curl localhost:10248/healthz
ok
我们再看一下 10250,10250实际是Kubelet的默认端口,/metrics 接口就是在这个端口暴露的,我们请求一下:
[root@tt-fc-dev01.nj ~]# curl localhost:10250/metrics
Client sent an HTTP request to an HTTPS server.
[root@tt-fc-dev01.nj ~]# curl https://localhost:10250/metrics
curl: (60) SSL certificate problem: self signed certificate in certificate chain
More details here: https://curl.haxx.se/docs/sslcerts.html
curl failed to verify the legitimacy of the server and therefore could not
establish a secure connection to it. To learn more about this situation and
how to fix it, please visit the web page mentioned above.
[root@tt-fc-dev01.nj ~]# curl -k https://localhost:10250/metrics
Unauthorized
-k 表示不校验SSL证书是否正确,最后的命令可以看到返回了 Unauthorized,表示认证失败,我们先来解决一下认证问题。认证是 Kubernetes 的一个知识点,这里先不展开(你需要Google一下了解基本常识),直接实操。
认证信息
下面的信息可以保存为 auth.yaml,创建了 ClusterRole、ServiceAccount、ClusterRoleBinding。
---
apiVersion: rbac.authorization.k8s.io/v1
kind: ClusterRole
metadata:
  name: categraf-daemonset
rules:
- apiGroups:
  - ""
  resources:
  - nodes/metrics
  - nodes/stats
  - nodes/proxy
  verbs:
  - get
---
apiVersion: v1
kind: ServiceAccount
metadata:
  name: categraf-daemonset
  namespace: flashcat
---
apiVersion: rbac.authorization.k8s.io/v1
kind: ClusterRoleBinding
metadata:
  name: categraf-daemonset
roleRef:
  apiGroup: rbac.authorization.k8s.io
  kind: ClusterRole
  name: categraf-daemonset
subjects:
- kind: ServiceAccount
  name: categraf-daemonset
  namespace: flashcat
ClusterRole是个全局概念,不属于任一个namespace,定义了很多权限点,都是读权限,监控嘛,读权限就可以了,ServiceAccount则是namespace颗粒度的一个概念,这里我们创建了一个名为categraf-daemonset的ServiceAccount,然后绑定到ClusterRole上面,具备了各种查询权限。apply一下即可:
[work@tt-fc-dev01.nj yamls]$ kubectl apply -f auth.yaml
clusterrole.rbac.authorization.k8s.io/categraf-daemonset created
serviceaccount/categraf-daemonset created
clusterrolebinding.rbac.authorization.k8s.io/categraf-daemonset created
[work@tt-fc-dev01.nj yamls]$ kubectl get ClusterRole | grep categraf-daemon
categraf-daemonset                                                     2022-11-14T03:53:54Z
[work@tt-fc-dev01.nj yamls]$ kubectl get sa -n flashcat
NAME                 SECRETS   AGE
categraf-daemonset   1         90m
default              1         4d23h
[work@tt-fc-dev01.nj yamls]$ kubectl get ClusterRoleBinding -n flashcat | grep categraf-daemon
categraf-daemonset ClusterRole/categraf-daemonset 91m
测试权限
上面的命令行输出可以看出来,我们已经成功创建了 ServiceAccount,把ServiceAccount的内容打印出来看一下:
[root@tt-fc-dev01.nj qinxiaohui]# kubectl get sa categraf-daemonset -n flashcat -o yaml
apiVersion: v1
kind: ServiceAccount
metadata:
  annotations:
    kubectl.kubernetes.io/last-applied-configuration: |
      {"apiVersion":"v1","kind":"ServiceAccount","metadata":{"annotations":{},"name":"categraf-daemonset","namespace":"flashcat"}}
  creationTimestamp: "2022-11-14T03:53:54Z"
  name: categraf-daemonset
  namespace: flashcat
  resourceVersion: "120570510"
  uid: 22f5a785-871c-4454-b82e-12bf104450a0
secrets:
- name: categraf-daemonset-token-7mccq
注意最后两行,这个ServiceAccount实际是关联了一个Secret,我们再看看这个Secret的内容:
[root@tt-fc-dev01.nj qinxiaohui]# kubectl get secret categraf-daemonset-token-7mccq -n flashcat -o yaml
apiVersion: v1
data:
  ca.crt: LS0tLS1CRUdJTiBDRVJUSUZJQ0FURS0tLS0tCk1JSUMvakNDQWVhZ0F3SUJBZ0lCQURBTkJna3Foa2lHOXcwQkFRc0ZBREFWTVJNd0VRWURWUVFERXdwcmRXSmwKY201bGRHVnpNQjRYRFRJeU1ERXdPVEF4TXpjek9Gb1hEVE15TURFd056QXhNemN6T0Zvd0ZURVRNQkVHQTFVRQpBeE1LYTNWaVpYSnVaWFJsY3pDQ0FTSXdEUVlKS29aSWh2Y05BUUVCQlFBRGdnRVBBRENDQVFvQ2dnRUJBS2F1Ck9wU3hHdXB0ZlNraW1zbmlONFVLWnp2b1p6akdoTks1eUVlZWFPcmptdXIwdTFVYlFHbTBRWlpMem8xVi9GV1gKVERBOUthcFRNVllyS2hBQjNCVXdqdGhCaFp1NjJVQzg5TmRNSDVzNFdmMGtMNENYZWQ3V2g2R05Md0MyQ2xKRwp3Tmp1UkZRTndxMWhNWjY4MGlaT1hLZk1NbEt6bWY4aDJWZmthREdpVHk0VzZHWE5sRlRJSFFkVFBVMHVMY3dYCmc1cUVsMkd2cklmd05JSXBOV3ZoOEJvaFhyc1pOZVNlNHhGMVFqY0R2QVE4Q0xta2J2T011UGI5bGtwalBCMmsKV055RTVtVEZCZ2NCQ3dzSGhjUHhyN0E3cXJXMmtxbU1MbUJpc2dHZm9ieXFWZy90cTYzS1oxYlRvWjBIbXhicQp6TkpOZUJpbm9jbi8xblJBK3NrQ0F3RUFBYU5aTUZjd0RnWURWUjBQQVFIL0JBUURBZ0trTUE4R0ExVWRFd0VCCi93UUZNQU1CQWY4d0hRWURWUjBPQkJZRUZLVkxrbVQ5RTNwTmp3aThsck5UdXVtRm1MWHNNQlVHQTFVZEVRUU8KTUF5Q0NtdDFZbVZ5Ym1WMFpYTXdEUVlKS29aSWh2Y05BUUVMQlFBRGdnRUJBSm5QR24rR012S1ZadFVtZVc2bQoxanY2SmYvNlBFS2JzSHRkN2dINHdwREI3YW9pQVBPeTE0bVlYL2d5WWgyZHdsRk9hTWllVS9vUFlmRDRUdGxGCkZMT08yVkdLVTJBSmFNYnVBekw4ZTlsTFREM0xLOGFJUm1FWFBhQkR2V3VUYXZuSTZCWDhiNUs4SndraVd0R24KUFh0ejZhOXZDK1BoaWZDR0phMkNxQWtJV0Nrc0lWenNJcWJ0dkEvb1pHK1dhMlduemFlMC9OUFl4QS8waldOMwpVcGtDWllFaUQ4VlUwenRIMmNRTFE4Z2Mrb21uc3ljaHNjaW5KN3JsZS9XbVFES3ZhVUxLL0xKVTU0Vm1DM2grCnZkaWZtQStlaFZVZnJaTWx6SEZRbWdzMVJGMU9VczNWWUd0REt5YW9uRkc0VFlKa1NvM0IvRlZOQ0ZtcnNHUTYKZWV3PQotLS0tLUVORCBDRVJUSUZJQ0FURS0tLS0tCg==
  namespace: Zmxhc2hjYXQ=
  token: ZXlKaGJHY2lPaUpTVXpJMU5pSXNJbXRwWkNJNklqRTJZVTlNU2pObFFVbEhlbmhDV1dsVmFIcEVTRlZVWVdoZlZVaDZSbmd6TUZGZlVWUjJUR0pzVUVraWZRLmV5SnBjM01pT2lKcmRXSmxjbTVsZEdWekwzTmxjblpwWTJWaFkyTnZkVzUwSWl3aWEzVmlaWEp1WlhSbGN5NXBieTl6WlhKMmFXTmxZV05qYjNWdWRDOXVZVzFsYzNCaFkyVWlPaUptYkdGemFHTmhkQ0lzSW10MVltVnlibVYwWlhNdWFXOHZjMlZ5ZG1salpXRmpZMjkxYm5RdmMyVmpjbVYwTG01aGJXVWlPaUpqWVhSbFozSmhaaTFrWVdWdGIyNXpaWFF0ZEc5clpXNHROMjFqWTNFaUxDSnJkV0psY201bGRHVnpMbWx2TDNObGNuWnBZMlZoWTJOdmRXNTBMM05sY25acFkyVXRZV05qYjNWdWRDNXVZVzFsSWpvaVkyRjBaV2R5WVdZdFpHRmxiVzl1YzJWMElpd2lhM1ZpWlhKdVpYUmxjeTVwYnk5elpYSjJhV05sWVdOamIzVnVkQzl6WlhKMmFXTmxMV0ZqWTI5MWJuUXVkV2xrSWpvaU1qSm1OV0UzT0RVdE9EY3hZeTAwTkRVMExXSTRNbVV0TVRKaVpqRXdORFExTUdFd0lpd2ljM1ZpSWpvaWMzbHpkR1Z0T25ObGNuWnBZMlZoWTJOdmRXNTBPbVpzWVhOb1kyRjBPbU5oZEdWbmNtRm1MV1JoWlcxdmJuTmxkQ0o5Lm03czJ2Z1JuZDJzMDJOUkVwakdpc0JYLVBiQjBiRjdTRUFqb2RjSk9KLWh6YWhzZU5FSDFjNGNDbXotMDN5Z1Rkal9NT1VKaWpCalRmaW9FSWpGZHRCS0hEMnNjNXlkbDIwbjU4VTBSVXVDemRYQl9tY0J1WDlWWFM2bE5zYVAxSXNMSGdscV9Sbm5XcDZaNmlCaWp6SU05QUNuckY3MGYtd1FZTkVLc2MzdGhubmhSX3E5MkdkZnhmdGU2NmhTRGthdGhPVFRuNmJ3ZnZMYVMxV1JCdEZ4WUlwdkJmVXpkQ1FBNVhRYVNPck00RFluTE5uVzAxWDNqUGVZSW5ka3NaQ256cmV6Tnp2OEt5VFRTSlJ2VHVKMlZOU2lHaDhxTEgyZ3IzenhtQm5Qb1d0czdYeFhBTkJadG0yd0E2OE5FXzY0SlVYS0tfTlhfYmxBbFViakwtUQ==
kind: Secret
metadata:
  annotations:
    kubernetes.io/service-account.name: categraf-daemonset
    kubernetes.io/service-account.uid: 22f5a785-871c-4454-b82e-12bf104450a0
  creationTimestamp: "2022-11-14T03:53:54Z"
  name: categraf-daemonset-token-7mccq
  namespace: flashcat
  resourceVersion: "120570509"
  uid: 0a228da5-6e60-4b22-beff-65cc56683e41
type: kubernetes.io/service-account-token
我们把这个token字段拿到,然后base64转码一下,作为Bearer Token来请求测试一下:
[root@tt-fc-dev01.nj qinxiaohui]# token=`kubectl get secret categraf-daemonset-token-7mccq -n flashcat -o jsonpath={.data.token} | base64 -d`
[root@tt-fc-dev01.nj qinxiaohui]# curl -s -k -H "Authorization: Bearer $token" https://localhost:10250/metrics > aaaa
[root@tt-fc-dev01.nj qinxiaohui]# head -n 5 aaaa
# HELP apiserver_audit_event_total [ALPHA] Counter of audit events generated and sent to the audit backend.
# TYPE apiserver_audit_event_total counter
apiserver_audit_event_total 0
# HELP apiserver_audit_requests_rejected_total [ALPHA] Counter of apiserver requests rejected due to an error in audit logging backend.
# TYPE apiserver_audit_requests_rejected_total counter
apiserver_audit_requests_rejected_total 0
通了!
这就说明我们创建的ServiceAccount是好使的,后面我们把 Categraf 作为采集器搞成 Daemonset,再为 Categraf 这个 Daemonset 指定 ServiceAccountName,Kubernetes就会自动把 Token 的内容挂到 Daemonset 的目录里,下面开始实操。
升级 Daemonset
上一篇咱们为 Kube-Proxy 的采集准备了 Daemonset,咱们就继续修改这个 Daemonset,让这个 Daemonset 不但可以采集 Kube-Proxy,也可以采集 Kubelet,先给 Categraf 准备一下相关的配置,可以把下面的内容保存为 categraf-configmap-v2.yaml
---
kind: ConfigMap
metadata:
  name: categraf-config
apiVersion: v1
data:
  config.toml: |
    [global]
    hostname = "$HOSTNAME"
    interval = 15
    providers = ["local"]
    [writer_opt]
    batch = 2000
    chan_size = 10000
    [[writers]]
    url = "http://10.206.0.16:19000/prometheus/v1/write"
    timeout = 5000
    dial_timeout = 2500
    max_idle_conns_per_host = 100
---
kind: ConfigMap
metadata:
  name: categraf-input-prometheus
apiVersion: v1
data:
  prometheus.toml: |
    [[instances]]
    urls = ["http://127.0.0.1:10249/metrics"]
    labels = { job="kube-proxy" }
    [[instances]]
    urls = ["https://127.0.0.1:10250/metrics"]
    bearer_token_file = "/var/run/secrets/kubernetes.io/serviceaccount/token"
    use_tls = true
    insecure_skip_verify = true
    labels = { job="kubelet" }
    [[instances]]
    urls = ["https://127.0.0.1:10250/metrics/cadvisor"]
    bearer_token_file = "/var/run/secrets/kubernetes.io/serviceaccount/token"
    use_tls = true
    insecure_skip_verify = true
    labels = { job="cadvisor" }
apply 一下,让新的配置生效:
[work@tt-fc-dev01.nj yamls]$ kubectl apply -f categraf-configmap-v2.yaml -n flashcat
configmap/categraf-config unchanged
configmap/categraf-input-prometheus configured
Categraf 的 Daemonset 需要把 ServiceAccountName 给绑定上,上一讲咱们用的 yaml 命名为:categraf-daemonset-v1.yaml ,咱们升级一下这个文件到 categraf-daemonset-v2.yaml 版本,内容如下:
apiVersion: apps/v1
kind: DaemonSet
metadata:
  labels:
    app: categraf-daemonset
  name: categraf-daemonset
spec:
  selector:
    matchLabels:
      app: categraf-daemonset
  template:
    metadata:
      labels:
        app: categraf-daemonset
    spec:
      containers:
      - env:
        - name: TZ
          value: Asia/Shanghai
        - name: HOSTNAME
          valueFrom:
            fieldRef:
              apiVersion: v1
              fieldPath: spec.nodeName
        - name: HOSTIP
          valueFrom:
            fieldRef:
              apiVersion: v1
              fieldPath: status.hostIP
        image: flashcatcloud/categraf:v0.2.18
        imagePullPolicy: IfNotPresent
        name: categraf
        volumeMounts:
        - mountPath: /etc/categraf/conf
          name: categraf-config
        - mountPath: /etc/categraf/conf/input.prometheus
          name: categraf-input-prometheus
      hostNetwork: true
      serviceAccountName: categraf-daemonset
      restartPolicy: Always
      tolerations:
      - effect: NoSchedule
        operator: Exists
      volumes:
      - configMap:
          name: categraf-config
        name: categraf-config
      - configMap:
          name: categraf-input-prometheus
        name: categraf-input-prometheus
这里跟 v1 版本相比,唯一的变化,就是加了 serviceAccountName: categraf-daemonset 这个配置,把原来的 Daemonset 删掉,从新创建一下:
[work@tt-fc-dev01.nj yamls]$ kubectl delete ds categraf-daemonset -n flashcat
daemonset.apps "categraf-daemonset" deleted
[work@tt-fc-dev01.nj yamls]$ kubectl apply -f categraf-daemonset-v2.yaml -n flashcat
daemonset.apps/categraf-daemonset created
waiting...
[work@tt-fc-dev01.nj yamls]$ kubectl get pods -n flashcat
NAME                       READY   STATUS    RESTARTS   AGE
categraf-daemonset-d8jt8   1/1     Running   0          37s
categraf-daemonset-fpx8v   1/1     Running   0          43s
categraf-daemonset-mp468   1/1     Running   0          32s
categraf-daemonset-s775l   1/1     Running   0          40s
categraf-daemonset-wxkjk   1/1     Running   0          47s
categraf-daemonset-zwscc   1/1     Running   0          35s
好了,我们去检查一下数据是否成功采集上来了:
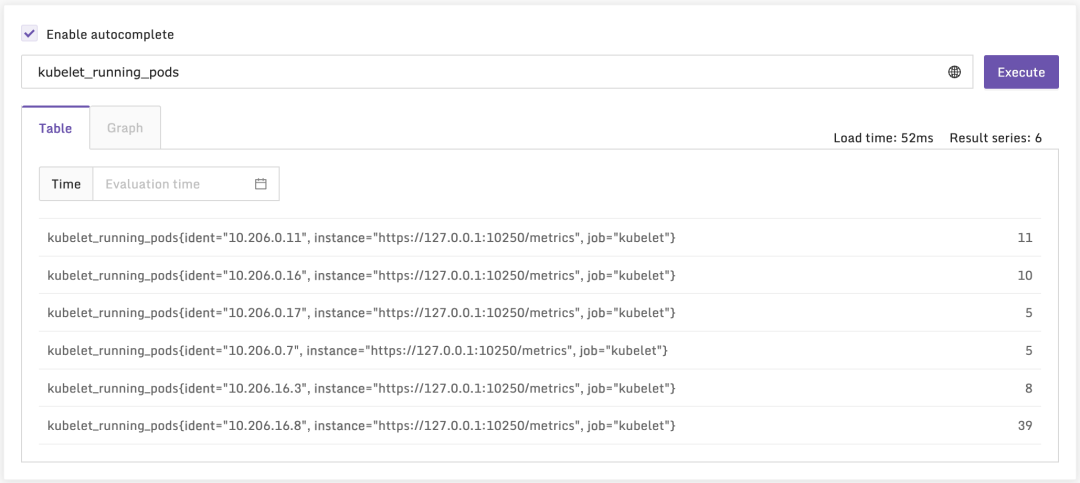
上面这个指标是 Kubelet 自身的,即从 Kubelet 的 /metrics 接口采集的,我们再来看一个 cAdvisor 的,即从 /metrics/cadvisor 接口采集的:
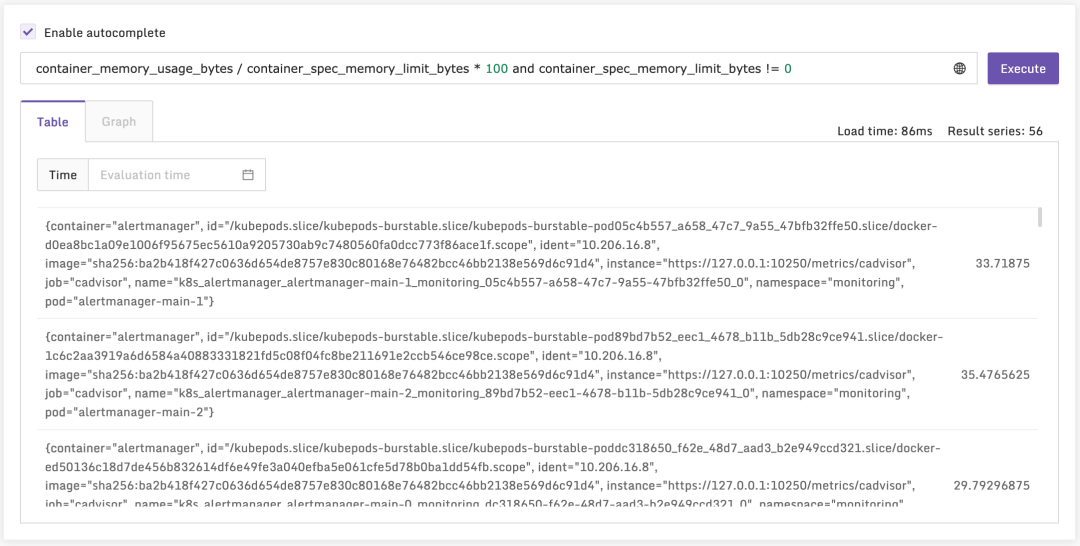
看起来数据都上来了,导入监控大盘看看效果。
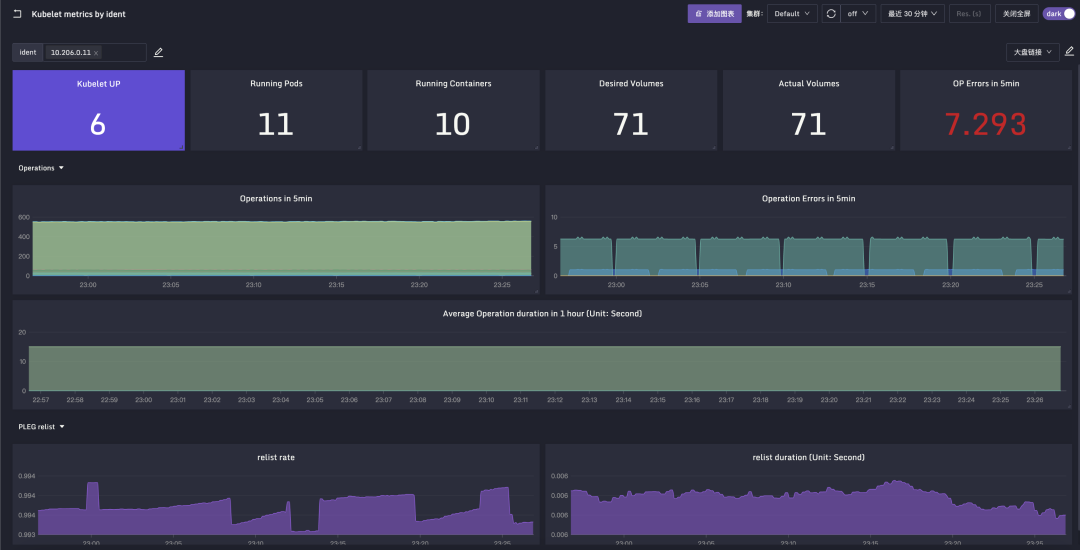
导入仪表盘
分成两部分,一个是 Kubelet 自身的仪表盘,JSON配置在这里,截图效果如下:
另外一个是Pod容器相关的大盘,JSON配置在这里(感谢张健老师悉心整理)
监控指标说明
之前孔飞老师整理的 Kubelet 相关指标的中文解释,我也一并附到这里,供大家参考:
# HELP go_gc_duration_seconds A summary of the pause duration of garbage collection cycles.
# TYPE go_gc_duration_seconds summary
gc的时间统计(summary指标)
HELP go_goroutines Number of goroutines that currently exist.
TYPE go_goroutines gauge
goroutine 数量
HELP go_threads Number of OS threads created.
TYPE go_threads gauge
线程数量
HELP kubelet_cgroup_manager_duration_seconds [ALPHA] Duration in seconds for cgroup manager operations. Broken down by method.
TYPE kubelet_cgroup_manager_duration_seconds histogram
操作cgroup的时长分布,按照操作类型统计
HELP kubelet_containers_per_pod_count [ALPHA] The number of containers per pod.
TYPE kubelet_containers_per_pod_count histogram
pod中container数量的统计(spec.containers的数量)
HELP kubelet_docker_operations_duration_seconds [ALPHA] Latency in seconds of Docker operations. Broken down by operation type.
TYPE kubelet_docker_operations_duration_seconds histogram
操作docker的时长分布,按照操作类型统计
HELP kubelet_docker_operations_errors_total [ALPHA] Cumulative number of Docker operation errors by operation type.
TYPE kubelet_docker_operations_errors_total counter
操作docker的错误累计次数,按照操作类型统计
HELP kubelet_docker_operations_timeout_total [ALPHA] Cumulative number of Docker operation timeout by operation type.
TYPE kubelet_docker_operations_timeout_total counter
操作docker的超时统计,按照操作类型统计
HELP kubelet_docker_operations_total [ALPHA] Cumulative number of Docker operations by operation type.
TYPE kubelet_docker_operations_total counter
操作docker的累计次数,按照操作类型统计
HELP kubelet_eviction_stats_age_seconds [ALPHA] Time between when stats are collected, and when pod is evicted based on those stats by eviction signal
TYPE kubelet_eviction_stats_age_seconds histogram
驱逐操作的时间分布,按照驱逐信号(原因)分类统计
HELP kubelet_evictions [ALPHA] Cumulative number of pod evictions by eviction signal
TYPE kubelet_evictions counter
驱逐次数统计,按照驱逐信号(原因)统计
HELP kubelet_http_inflight_requests [ALPHA] Number of the inflight http requests
TYPE kubelet_http_inflight_requests gauge
请求kubelet的inflight请求数,按照method path server_type统计, 注意与每秒的request数区别开
HELP kubelet_http_requests_duration_seconds [ALPHA] Duration in seconds to serve http requests
TYPE kubelet_http_requests_duration_seconds histogram
请求kubelet的请求时间统计, 按照method path server_type统计
HELP kubelet_http_requests_total [ALPHA] Number of the http requests received since the server started
TYPE kubelet_http_requests_total counter
请求kubelet的请求数统计,按照method path server_type统计
HELP kubelet_managed_ephemeral_containers [ALPHA] Current number of ephemeral containers in pods managed by this kubelet. Ephemeral containers will be ignored if disabled by the EphemeralContainers feature gate, and this number will be 0.
TYPE kubelet_managed_ephemeral_containers gauge
当前kubelet管理的临时容器数量
HELP kubelet_network_plugin_operations_duration_seconds [ALPHA] Latency in seconds of network plugin operations. Broken down by operation type.
TYPE kubelet_network_plugin_operations_duration_seconds histogram
网络插件的操作耗时分布 ,按照操作类型(operation_type)统计, 如果 --feature-gates=EphemeralContainers=false, 否则一直为0
HELP kubelet_network_plugin_operations_errors_total [ALPHA] Cumulative number of network plugin operation errors by operation type.
TYPE kubelet_network_plugin_operations_errors_total counter
网络插件累计操作错误数统计,按照操作类型(operation_type)统计
HELP kubelet_network_plugin_operations_total [ALPHA] Cumulative number of network plugin operations by operation type.
TYPE kubelet_network_plugin_operations_total counter
网络插件累计操作数统计,按照操作类型(operation_type)统计
HELP kubelet_node_name [ALPHA] The node's name. The count is always 1.
TYPE kubelet_node_name gauge
node name
HELP kubelet_pleg_discard_events [ALPHA] The number of discard events in PLEG.
TYPE kubelet_pleg_discard_events counter
PLEG(pod lifecycle event generator) 丢弃的event数统计
HELP kubelet_pleg_last_seen_seconds [ALPHA] Timestamp in seconds when PLEG was last seen active.
TYPE kubelet_pleg_last_seen_seconds gauge
PLEG上次活跃的时间戳
HELP kubelet_pleg_relist_duration_seconds [ALPHA] Duration in seconds for relisting pods in PLEG.
TYPE kubelet_pleg_relist_duration_seconds histogram
PLEG relist pod时间分布
HELP kubelet_pleg_relist_interval_seconds [ALPHA] Interval in seconds between relisting in PLEG.
TYPE kubelet_pleg_relist_interval_seconds histogram
PLEG relist 间隔时间分布
HELP kubelet_pod_start_duration_seconds [ALPHA] Duration in seconds for a single pod to go from pending to running.
TYPE kubelet_pod_start_duration_seconds histogram
pod启动时间(从pending到running)分布, kubelet watch到pod时到pod中contianer都running后, watch各种source channel的pod变更
HELP kubelet_pod_worker_duration_seconds [ALPHA] Duration in seconds to sync a single pod. Broken down by operation type: create, update, or sync
TYPE kubelet_pod_worker_duration_seconds histogram
pod状态变化的时间分布, 按照操作类型(create update sync)统计, worker就是kubelet中处理一个pod的逻辑工作单位
HELP kubelet_pod_worker_start_duration_seconds [ALPHA] Duration in seconds from seeing a pod to starting a worker.
TYPE kubelet_pod_worker_start_duration_seconds histogram
kubelet watch到pod到worker启动的时间分布
HELP kubelet_run_podsandbox_duration_seconds [ALPHA] Duration in seconds of the run_podsandbox operations. Broken down by RuntimeClass.Handler.
TYPE kubelet_run_podsandbox_duration_seconds histogram
启动sandbox的时间分布
HELP kubelet_run_podsandbox_errors_total [ALPHA] Cumulative number of the run_podsandbox operation errors by RuntimeClass.Handler.
TYPE kubelet_run_podsandbox_errors_total counter
启动sanbox出现error的总数
HELP kubelet_running_containers [ALPHA] Number of containers currently running
TYPE kubelet_running_containers gauge
当前containers运行状态的统计, 按照container状态统计,created running exited
HELP kubelet_running_pods [ALPHA] Number of pods that have a running pod sandbox
TYPE kubelet_running_pods gauge
当前处于running状态pod数量
HELP kubelet_runtime_operations_duration_seconds [ALPHA] Duration in seconds of runtime operations. Broken down by operation type.
TYPE kubelet_runtime_operations_duration_seconds histogram
容器运行时的操作耗时(container在create list exec remove stop等的耗时)
HELP kubelet_runtime_operations_errors_total [ALPHA] Cumulative number of runtime operation errors by operation type.
TYPE kubelet_runtime_operations_errors_total counter
容器运行时的操作错误数统计(按操作类型统计)
HELP kubelet_runtime_operations_total [ALPHA] Cumulative number of runtime operations by operation type.
TYPE kubelet_runtime_operations_total counter
容器运行时的操作总数统计(按操作类型统计)
HELP kubelet_started_containers_errors_total [ALPHA] Cumulative number of errors when starting containers
TYPE kubelet_started_containers_errors_total counter
kubelet启动容器错误总数统计(按code和container_type统计)
code包括ErrImagePull ErrImageInspect ErrImagePull ErrRegistryUnavailable ErrInvalidImageName等
container_type一般为"container" "podsandbox"
HELP kubelet_started_containers_total [ALPHA] Cumulative number of containers started
TYPE kubelet_started_containers_total counter
kubelet启动容器总数
HELP kubelet_started_pods_errors_total [ALPHA] Cumulative number of errors when starting pods
TYPE kubelet_started_pods_errors_total counter
kubelet启动pod遇到的错误总数(只有创建sandbox遇到错误才会统计)
HELP kubelet_started_pods_total [ALPHA] Cumulative number of pods started
TYPE kubelet_started_pods_total counter
kubelet启动的pod总数
HELP process_cpu_seconds_total Total user and system CPU time spent in seconds.
TYPE process_cpu_seconds_total counter
统计cpu使用率
HELP process_max_fds Maximum number of open file descriptors.
TYPE process_max_fds gauge
允许进程打开的最大fd数
HELP process_open_fds Number of open file descriptors.
TYPE process_open_fds gauge
当前打开的fd数量
HELP process_resident_memory_bytes Resident memory size in bytes.
TYPE process_resident_memory_bytes gauge
进程驻留内存大小
HELP process_start_time_seconds Start time of the process since unix epoch in seconds.
TYPE process_start_time_seconds gauge
进程启动时间
HELP rest_client_request_duration_seconds [ALPHA] Request latency in seconds. Broken down by verb and URL.
TYPE rest_client_request_duration_seconds histogram
请求apiserver的耗时统计(按照url和请求类型统计verb)
HELP rest_client_requests_total [ALPHA] Number of HTTP requests, partitioned by status code, method, and host.
TYPE rest_client_requests_total counter
请求apiserver的总次数(按照返回码code和请求类型method统计)
HELP storage_operation_duration_seconds [ALPHA] Storage operation duration
TYPE storage_operation_duration_seconds histogram
存储操作耗时(按照存储plugin(configmap emptydir hostpath 等 )和operation_name分类统计)
HELP volume_manager_total_volumes [ALPHA] Number of volumes in Volume Manager
TYPE volume_manager_total_volumes gauge
本机挂载的volume数量统计(按照plugin_name和state统计
plugin_name包括"host-path" "empty-dir" "configmap" "projected")
state(desired_state_of_world期状态/actual_state_of_world实际状态)
下面是 cAdvisor 指标梳理:
# HELP container_cpu_cfs_periods_total Number of elapsed enforcement period intervals.
# TYPE container_cpu_cfs_periods_total counter
cfs时间片总数, 完全公平调度的时间片总数(分配到cpu的时间片数)
HELP container_cpu_cfs_throttled_periods_total Number of throttled period intervals.
TYPE container_cpu_cfs_throttled_periods_total counter
容器被throttle的时间片总数
HELP container_cpu_cfs_throttled_seconds_total Total time duration the container has been throttled.
TYPE container_cpu_cfs_throttled_seconds_total counter
容器被throttle的时间
HELP container_file_descriptors Number of open file descriptors for the container.
TYPE container_file_descriptors gauge
容器打开的fd数
HELP container_memory_usage_bytes Current memory usage in bytes, including all memory regardless of when it was accessed
TYPE container_memory_usage_bytes gauge
容器内存使用量,单位byte
HELP container_network_receive_bytes_total Cumulative count of bytes received
TYPE container_network_receive_bytes_total counter
容器入方向的流量
HELP container_network_transmit_bytes_total Cumulative count of bytes transmitted
TYPE container_network_transmit_bytes_total counter
容器出方向的流量
HELP container_spec_cpu_period CPU period of the container.
TYPE container_spec_cpu_period gauge
容器的cpu调度单位时间
HELP container_spec_cpu_quota CPU quota of the container.
TYPE container_spec_cpu_quota gauge
容器的cpu规格 ,除以单位调度时间可以计算核数
HELP container_spec_memory_limit_bytes Memory limit for the container.
TYPE container_spec_memory_limit_bytes gauge
容器的内存规格,单位byte
HELP container_threads Number of threads running inside the container
TYPE container_threads gauge
容器当前的线程数
HELP container_threads_max Maximum number of threads allowed inside the container, infinity if value is zero
TYPE container_threads_max gauge
允许容器启动的最大线程数