1- 镜像
prometheuscommunity/elasticsearch-exporter:v1.5.0 # 默认端口9114
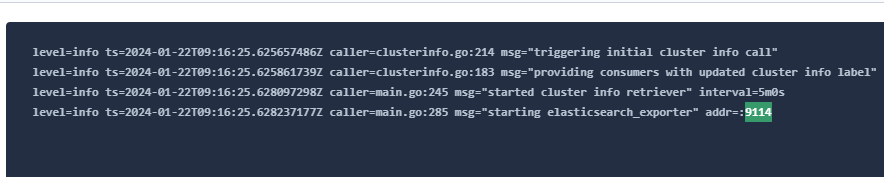
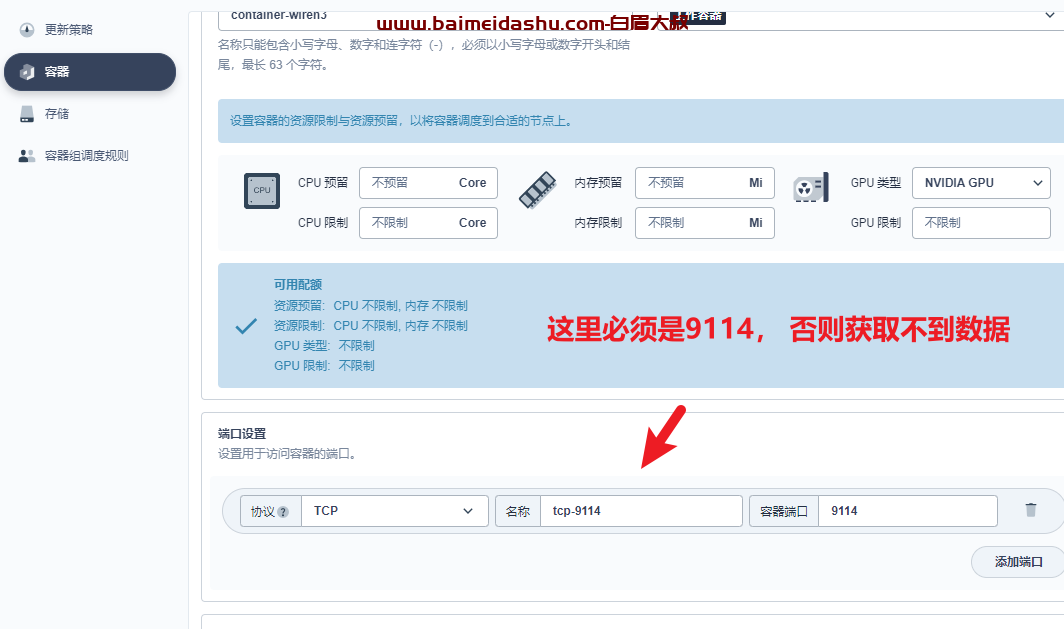
发现有个坑 默认是7979 ,但是里边走的是9114
2- 启动命令
/bin/elasticsearch_exporter,--es.uri=http://192.168.1.250:9200
带权限的可以参考
nohup ./elasticsearch_exporter --es.all --es.indices --es.cluster_settings --es.indices_settings --es.shards --es.snapshots --es.timeout=10s --web.listen-address=":9114" --web.telemetry-path="/metrics" --es.uri http://elastic:FtBMPT31rPiQ@192.168.2.40:9200 &
(uri中要写成自己es的用户和密码)
我写:
/bin/elasticsearch_exporter,--es.uri=http://elastic:baimei.123@192.168.1.250:9200,--es.timeout=10s
3- 检测数据:
http://10.0.0.201:31006/metrics
4- 配置prometheus
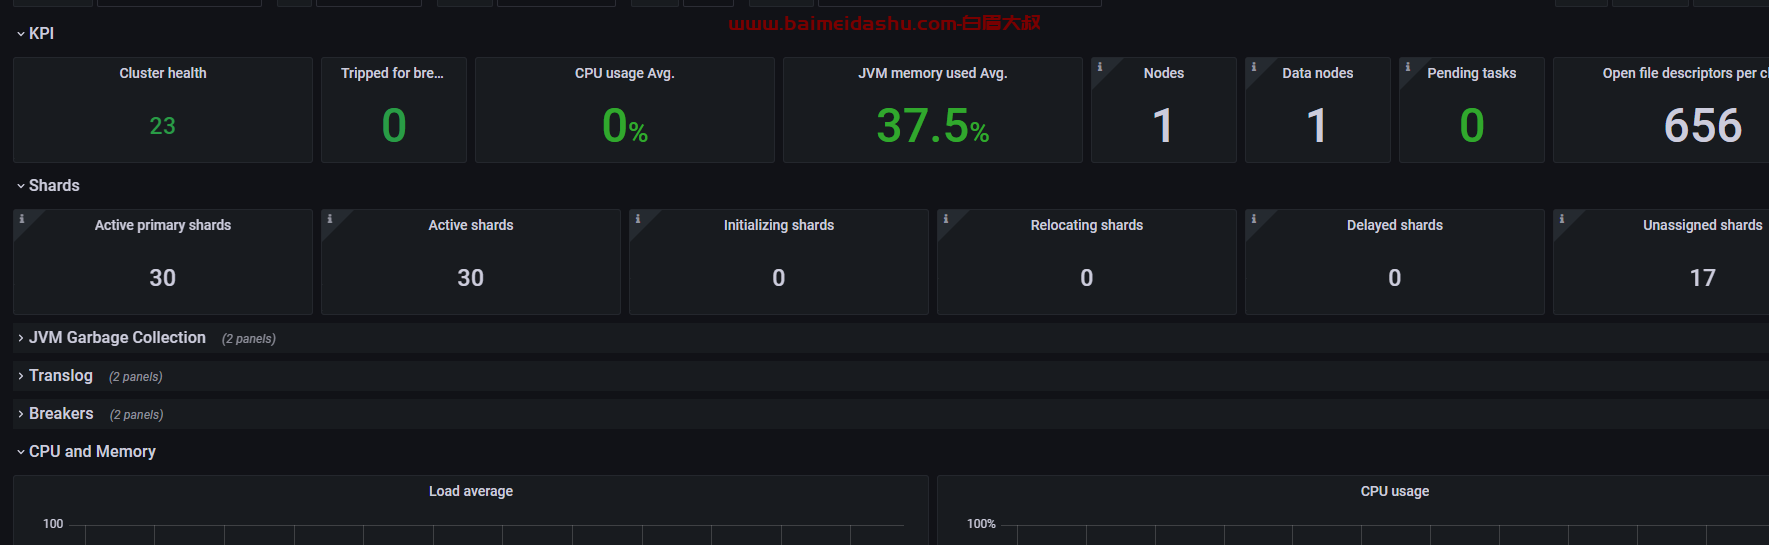
5- 配置granfa
https://grafana.com/grafana/dashboards/14191-elasticsearch-overview
14191