什么是Prometheus?
Prometheus是由SoundCloud开发的开源监控报警系统和时序列数据库(TSDB)。Prometheus使用Go语言开发,是Google BorgMon监控系统的开源版本。
Prometheus的特点
- 多维度数据模型。
- 灵活的查询语言。
- 不依赖分布式存储,单个服务器节点是自主的。
- 通过基于HTTP的pull方式采集时序数据。
- 可以通过中间网关进行时序列数据推送。
- 通过服务发现或者静态配置来发现目标服务对象。
- 支持多种多样的图表和界面展示,比如Grafana等
Prometheus的组件
Prometheus生态系统由多个组件组成,它们中的一些是可选的。多数Prometheus组件是Go语言写的,这使得这些组件很容易编译和部署。文章源自小柒网-https://www.yangxingzhen.cn/6625.html
- Prometheus Server
主要负责数据采集和存储,提供PromQL查询语言的支持。文章源自小柒网-https://www.yangxingzhen.cn/6625.html
- 客户端SDK
官方提供的客户端类库有go、java、scala、python、ruby,其他还有很多第三方开发的类库,支持nodejs、php、erlang等。文章源自小柒网-https://www.yangxingzhen.cn/6625.html
- Push Gateway
支持临时性Job主动推送指标的中间网关。文章源自小柒网-https://www.yangxingzhen.cn/6625.html
- Exporter
Exporter是Prometheus的一类数据采集组件的总称。它负责从目标处搜集数据,并将其转化为Prometheus支持的格式。与传统的数据采集组件不同的是,它并不向中央服务器发送数据,而是等待中央服务器主动前来抓取。文章源自小柒网-https://www.yangxingzhen.cn/6625.html
Prometheus提供多种类型的Exporter用于采集各种不同服务的运行状态。目前支持的有数据库、硬件、消息中间件、存储系统、HTTP服务器、JMX等。文章源自小柒网-https://www.yangxingzhen.cn/6625.html
- alertmanager
警告管理器,用来进行报警。文章源自小柒网-https://www.yangxingzhen.cn/6625.html
- 其他辅助性工具
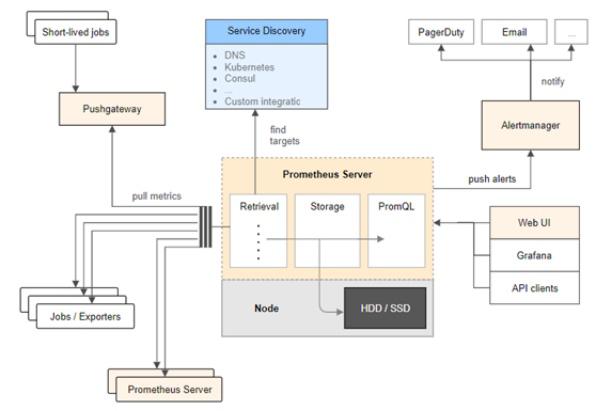
Prometheus系统架构图
 文章源自小柒网-https://www.yangxingzhen.cn/6625.html
它的服务过程是这样的 Prometheus daemon 负责定时去目标上抓取 metrics(指标) 数据,每个抓取目标需要暴露一个http服务的接口给它定时抓取。文章源自小柒网-https://www.yangxingzhen.cn/6625.html
Prometheus支持通过配置文件、文本文件、zookeeper、Consul、DNS SRV lookup等方式指定抓取目标。文章源自小柒网-https://www.yangxingzhen.cn/6625.html
Alertmanager 是独立于Prometheus的一个组件,可以支持Prometheus的查询语句,提供十分灵活的报警方式。
Prometheus支持很多方式的图表可视化,例如十分精美的Grafana,自带的Promdash,以及自身提供的模版引擎等等,还提供HTTP API的查询方式,自定义所需要的输出。
PushGateway这个组件是支持Client主动推送 metrics 到PushGateway,而Prometheus只是定时去Gateway上抓取数据。
Prometheus 的数据模型
Prometheus 从根本上所有的存储都是按时间序列去实现的,相同的 metrics(指标名称) 和 label(一个或多个标签) 组成一条时间序列,不同的label表示不同的时间序列。为了支持一些查询,有时还会临时产生一些时间序列存储。
metrics name & label 指标名称和标签
每条时间序列是由唯一的 指标名称 和 一组 标签 (key=value)的形式组成。
指标名称 一般是给监测对像起一名字,例如 http_requests_total 这样,它有一些命名规则,可以包字母数字_之类的的。
通常是以应用名称开头_监测对像_数值类型_单位这样。
例如:
1)push_total
2)userlogin_mysql_duration_seconds
3)app_memory_usage_bytes
标签就是对一条时间序列不同维度的识别了,例如:一个http请求用的是POST还是GET,它的endpoint是什么,这时候就要用标签去标记了。
最终形成的标识便是这样了
http_requests_total{method="POST",endpoint="/api/tracks"}
记住,针对http_requests_total这个metrics name 无论是增加标签还是删除标签都会形成一条新的时间序列。
查询语句就可以跟据上面标签的组合来查询聚合结果了。
如果以传统数据库的理解来看这条语句,则可以考虑 http_requests_total是表名,标签是字段,而timestamp是主键,还有一个float64字段是值了。(Prometheus里面所有值都是按float64存储)
Prometheus的四种数据类型
Counter
- Counter 用于累计值,例如 记录 请求次数、任务完成数、错误发生次数。
- 一直增加,不会减少。
- 重启进程后,会被重置。
例如:http_response_total{method="GET",endpoint="/api/tracks"} 100
10秒后抓取 http_response_total{method="GET",endpoint="/api/tracks"} 100
Gauge
- Gauge 常规数值,例如 温度变化、内存使用变化。
- 可变大,可变小。
- 重启进程后,会被重置
例如: memory_usage_bytes{host="master-01"} 100 < 抓取值
memory_usage_bytes{host="master-01"} 30
memory_usage_bytes{host="master-01"} 50
memory_usage_bytes{host="master-01"} 80 < 抓取值
Histogram
- Histogram 可以理解为柱状图的意思,常用于跟踪事件发生的规模,例如:请求耗时、响应大小。它特别之处是可以对记录的内容进行分组,提供 count 和 sum 全部值的功能。
例如:{小于10=5次,小于20=1次,小于30=2次},count=7次,sum=7次的求和值
Summary
- Summary和Histogram十分相似,常用于跟踪事件发生的规模,例如:请求耗时、响应大小。同样提供 count 和 sum 全部值的功能。
- 例如:count=7次,sum=7次的值求值
- 它提供一个quantiles的功能,可以按%比划分跟踪的结果。例如:quantile取值0.95,表示取采样值里面的95%数据。
大部分监控项都可以使用Counter来实现,少部分使用Gauge和Histogram,其中Histogram在服务端计算是相当费CPU的,所以也没要导出太多Histogram数据。
Prometheus适用的场景
Prometheus在记录纯数字时间序列方面表现非常好。它既适用于面向服务器等硬件指标的监控,也适用于高动态的面向服务架构的监控。对于现在流行的微服务,Prometheus的多维度数据收集和数据筛选查询语言也是非常的强大。Prometheus是为服务的可靠性而设计的,当服务出现故障时,它可以使你快速定位和诊断问题。它的搭建过程对硬件和服务没有很强的依赖关系。
Prometheus不适用的场景
Prometheus它的价值在于可靠性,甚至在很恶劣的环境下,你都可以随时访问它和查看系统服务各种指标的统计信息。如果你对统计数据需要100%的精确,它并不适用,例如:它不适用于实时计费系统。
Prometheus安装
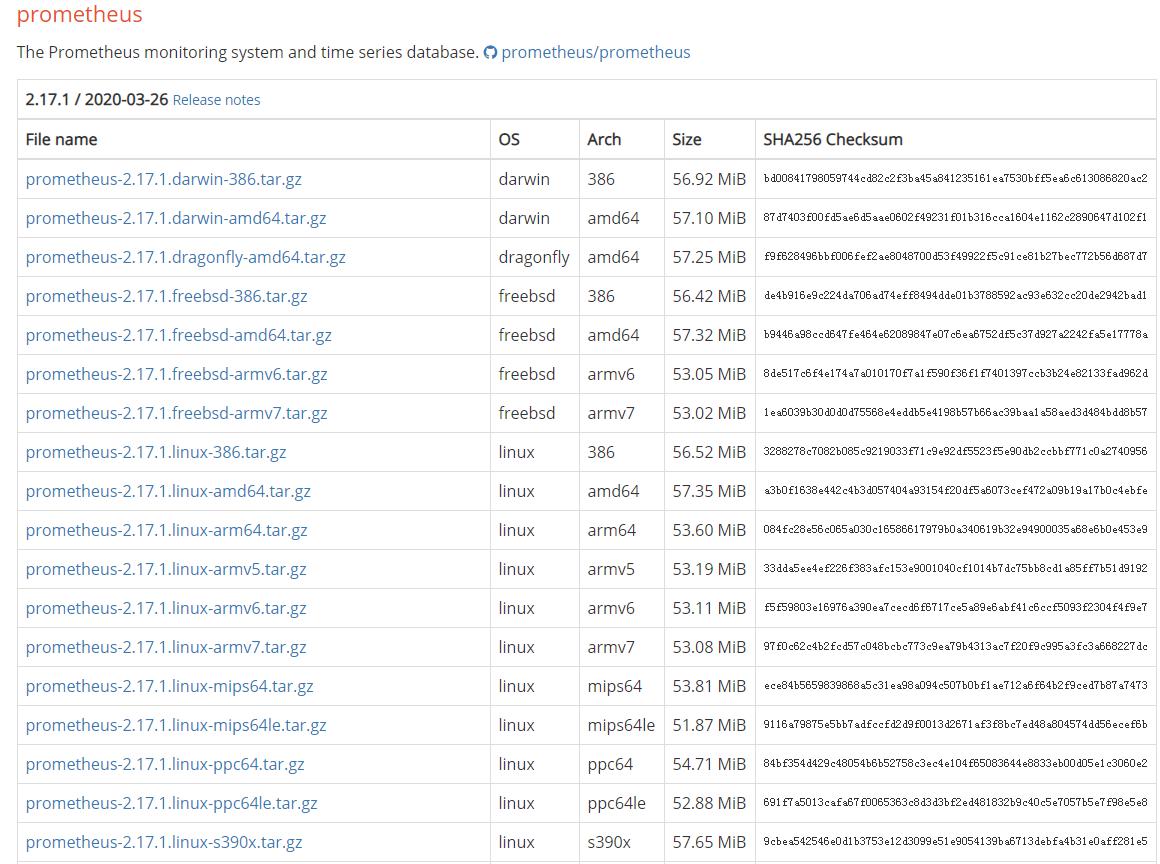
官网地址:++https://prometheus.io++
下载Prometheus
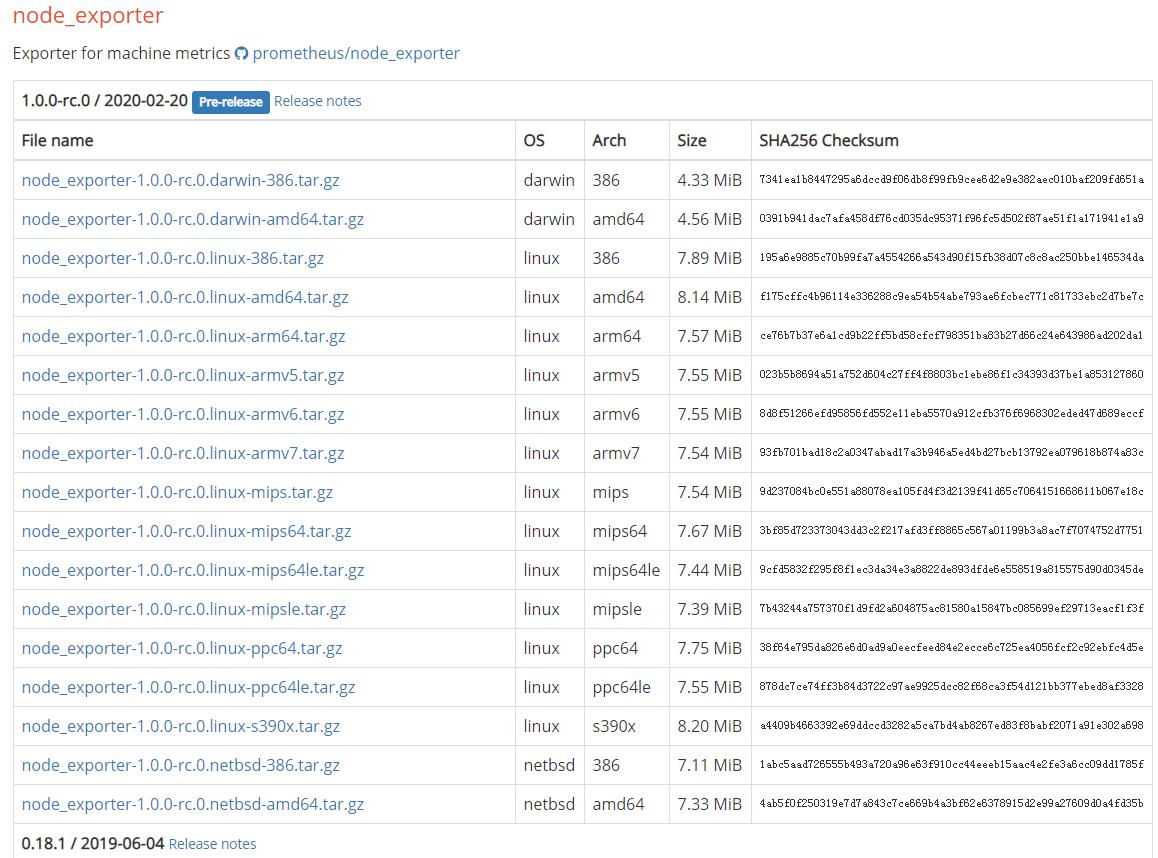
下载node_exporter
node_exporter收集远程机器的监控数据,提供给Prometheus定时来抓取。
1、安装node_exporter
1)下载node_exporter安装包
[root@localhost ~]# wget https://github.com/prometheus/node_exporter/releases/download/v1.0.0-rc.0/node_exporter-1.0.0-rc.0.linux-amd64.tar.gz
2)解压node_exporter安装包
[root@localhost ~]# tar xf node_exporter-1.0.0-rc.0.linux-amd64.tar.gz
3)重命名
[root@localhost ~]# mv node_exporter-1.0.0-rc.0.linux-amd64 /usr/local/node_exporter
4)启动node_exporter
[root@localhost prometheus]# cd /usr/local/node_exporter
[root@localhost node_exporter]# nohup ./node_exporter &
2、安装Prometheus
1)下载Prometheus安装包
[root@localhost ~]# wget https://github.com/prometheus/prometheus/releases/download/v2.17.1/prometheus-2.17.1.linux-amd64.tar.gz
2)解压Prometheus安装包
[root@localhost prometheus]# tar xf prometheus-2.17.1.linux-amd64.tar.gz
3)重命名
[root@localhost prometheus]# mv prometheus-2.17.1.linux-amd64 /usr/local/prometheus
4)编辑Prometheus配置文件
[root@localhost prometheus]# cd /usr/local/prometheus
[root@localhost prometheus]# vim prometheus.yml
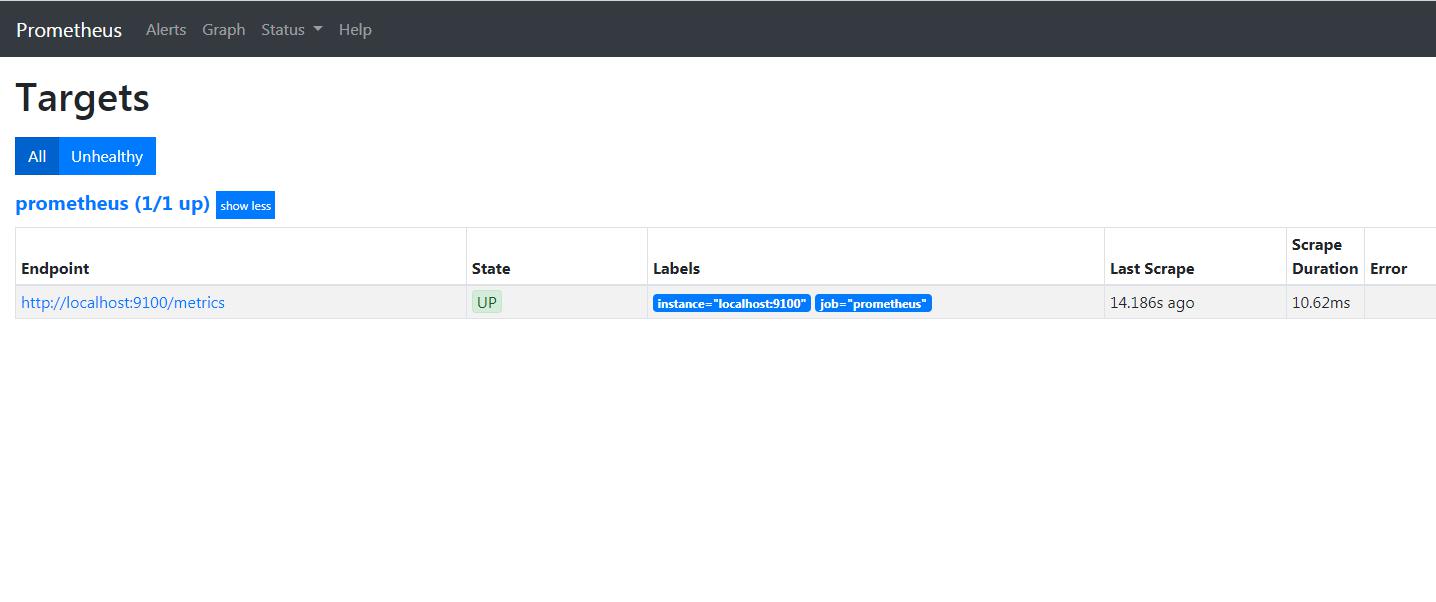
编辑prometheus.yml, 将node_exporter添加到Prometheus目标对象,因为这里node_exporter和Prometheus安装在同一台机器,使用localhost即可,node_exporter端口9100
global:
alerting:
  alertmanagers:
  - static_configs:
    - targets:
rule_files:
scrape_configs:
  - job_name: 'prometheus'
    static_configs:
    - targets: ['localhost:9100']
5)启动Prometheus
#使用配置文件启动Prometheus
[root@localhost prometheus]# nohup ./prometheus --config.file=prometheus.yml &
6)查询端口(9090)
[root@localhost prometheus]# netstat -lntup |grep 9090
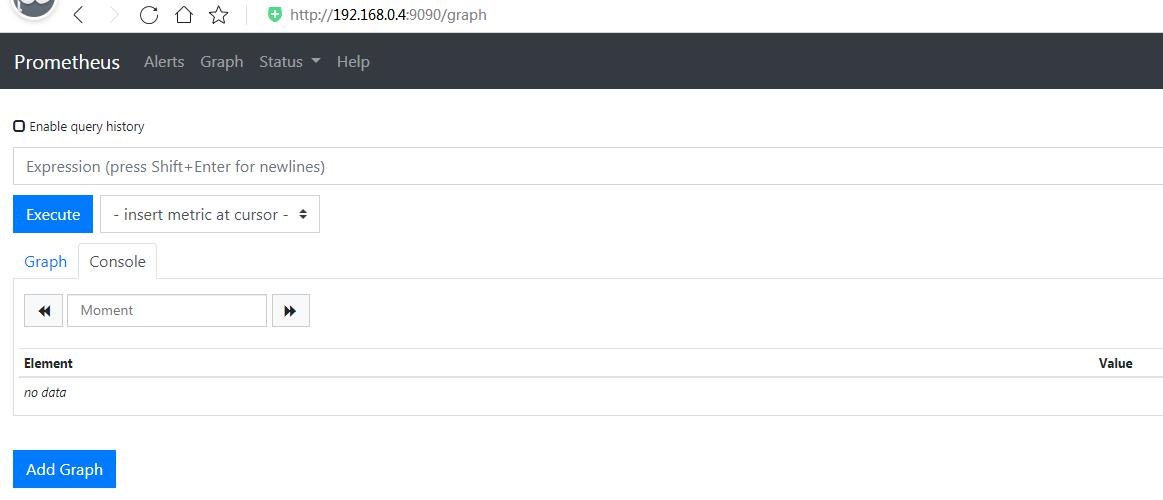
7)验证Prometheus是否安装成功
#打开浏览器访问:服务器IP+端口,如下图
Grafana
Grafana 是一个开箱即用的可视化工具,具有功能齐全的度量仪表盘和图形编辑器,有灵活丰富的图形化选项,可以混合多种风格,支持多个数据源特点。
Grafana安装可参考另外一篇文章(++可视化工具Grafana安装++),这里不再一一阐述。
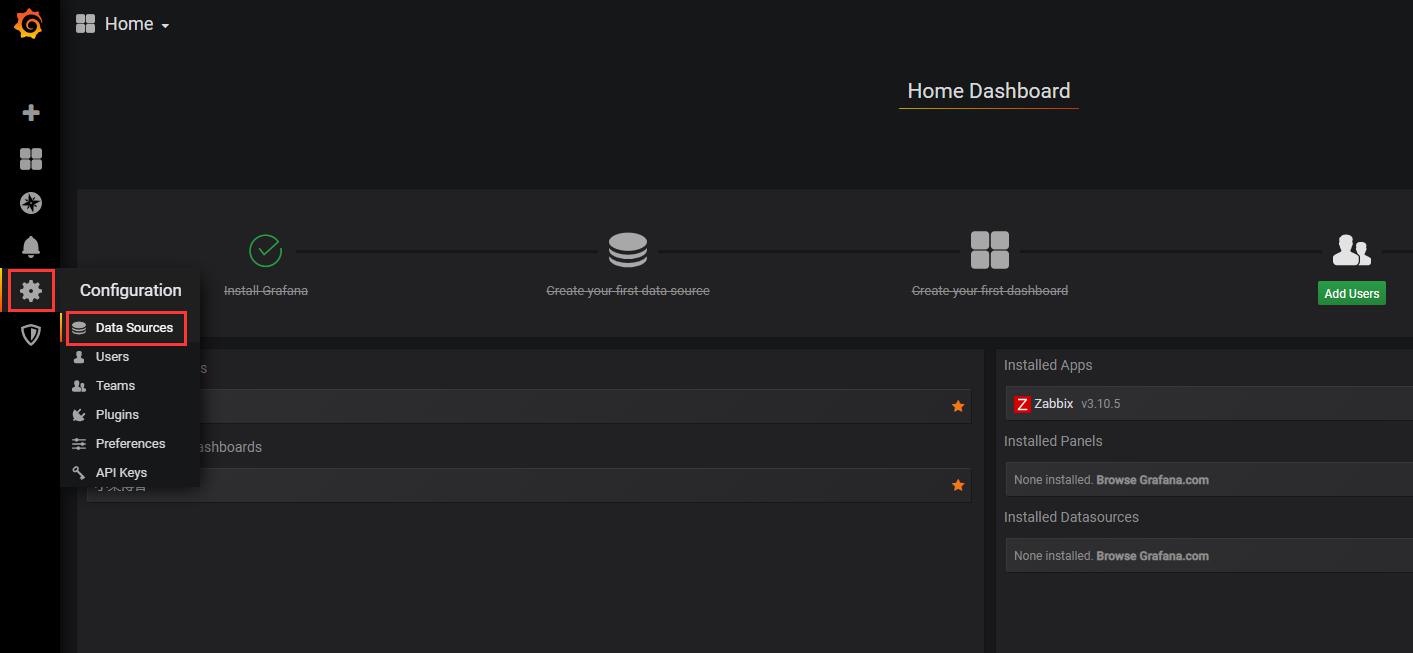
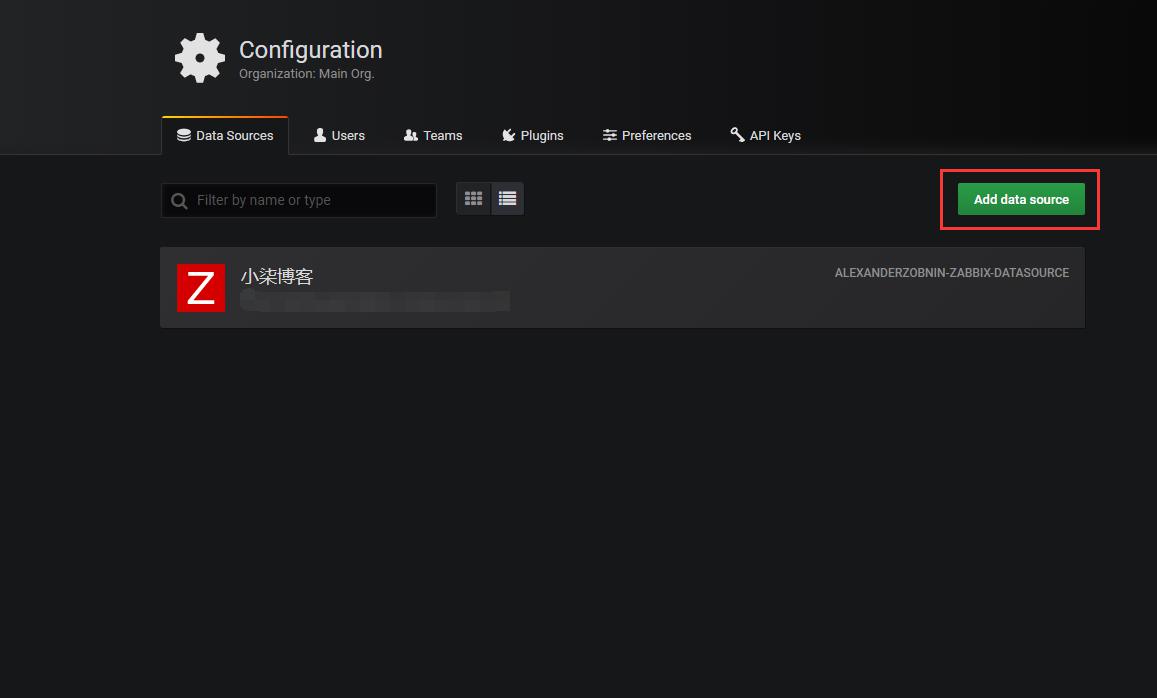
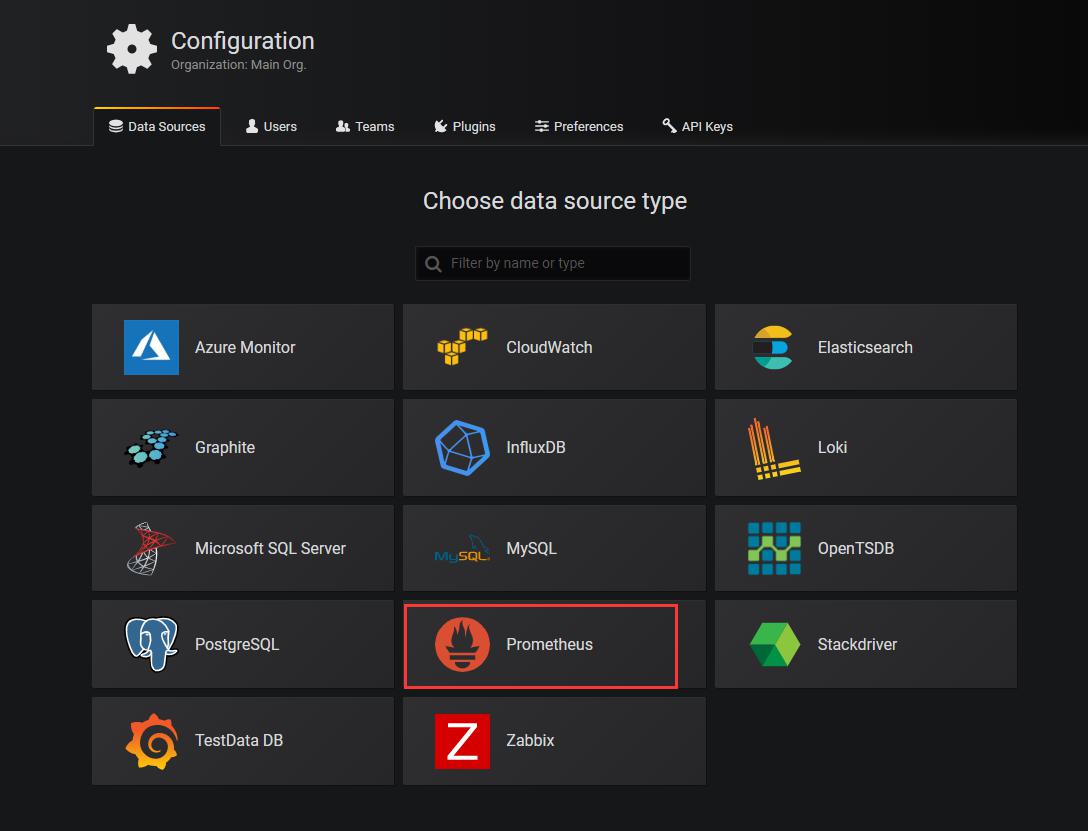
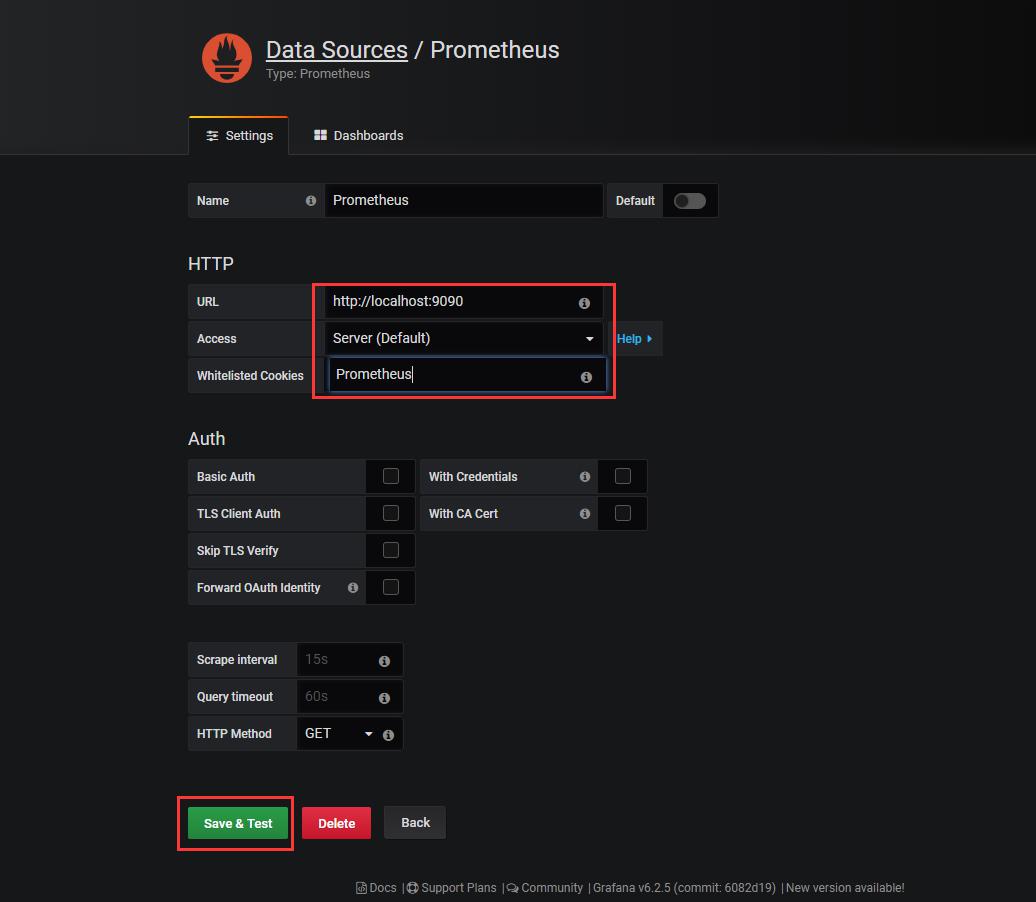
1、配置数据源
1)选择Add data source
2)选择Prometheus
3)输入对应的参数信息
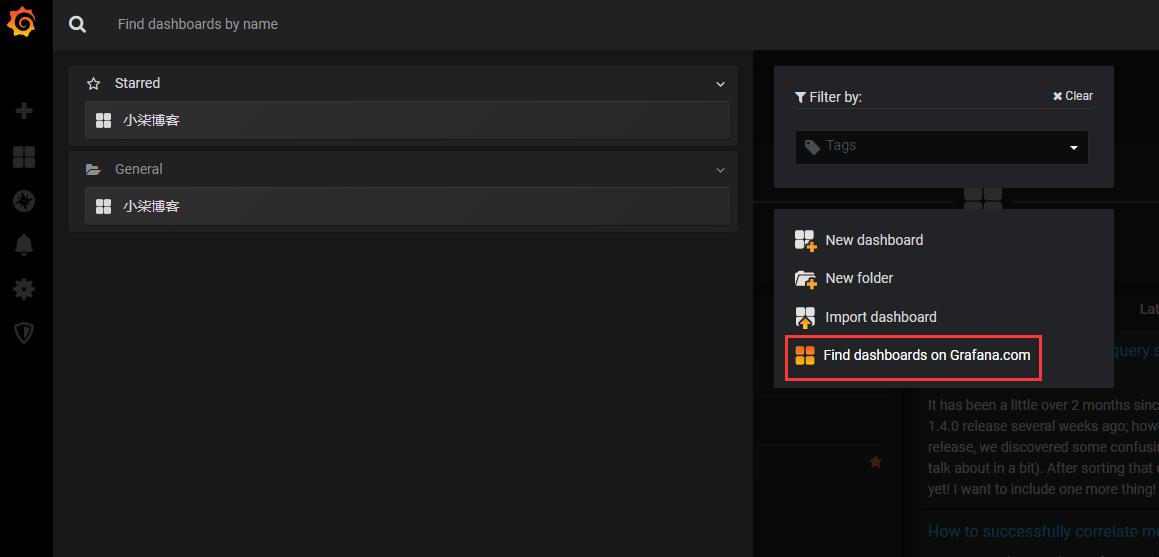
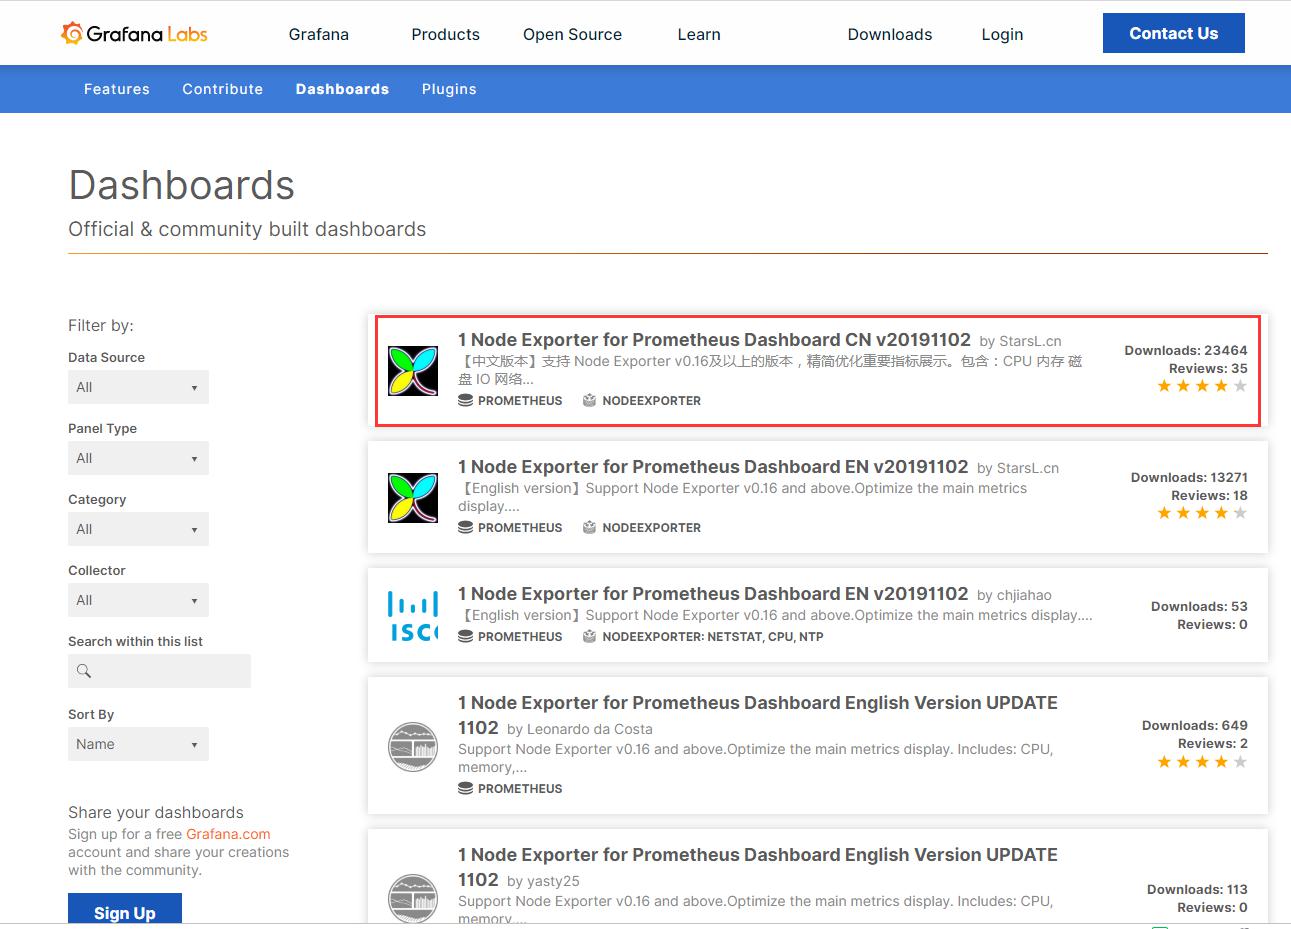
2、下载模板
1)选择需要下载的模板
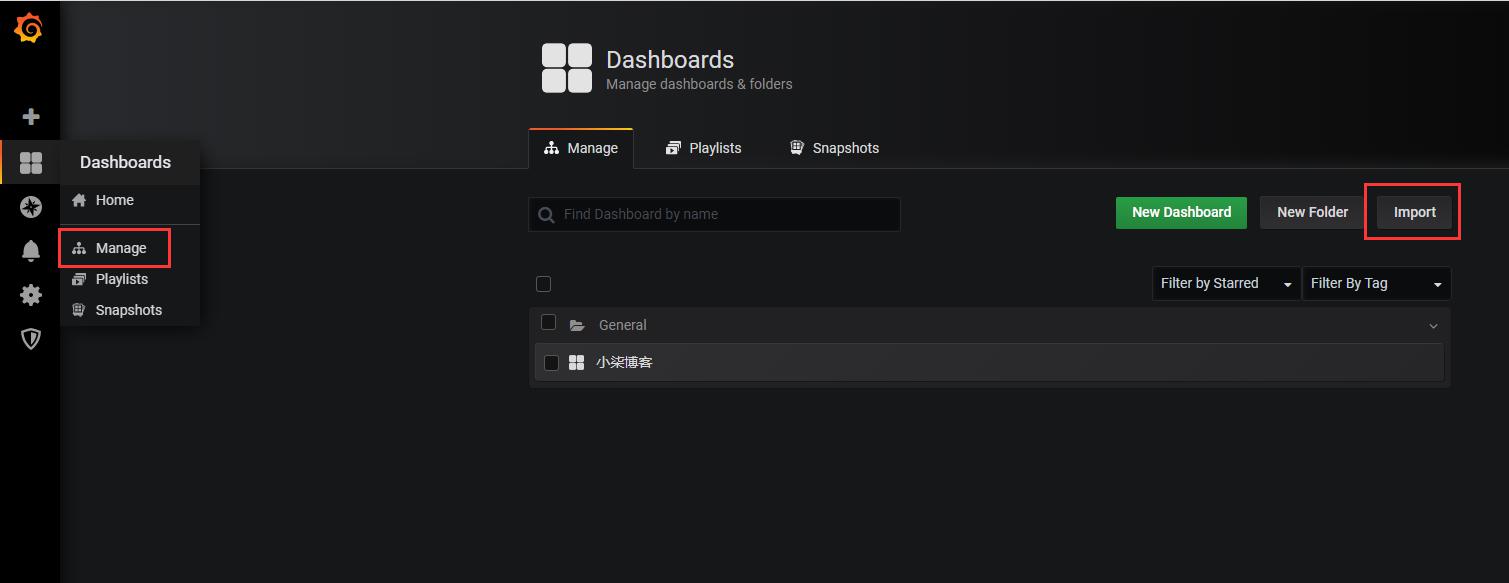
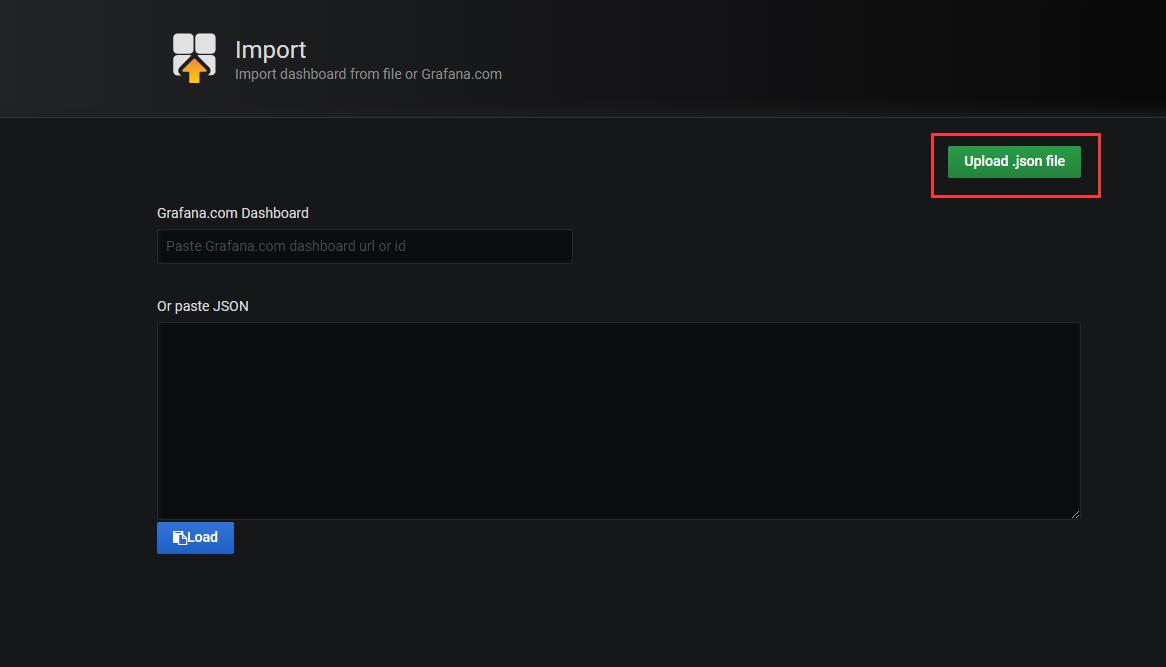
3、导入模板
1)选择下载好的模板文件
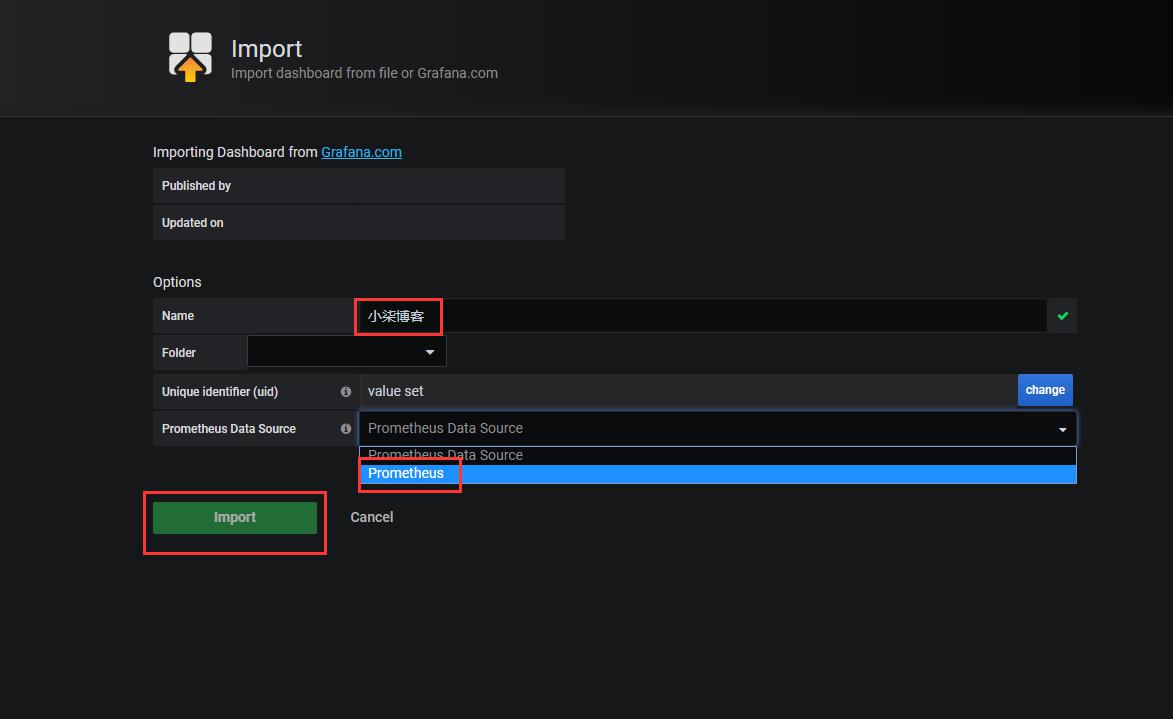
2)输入Name名称、选择数据源
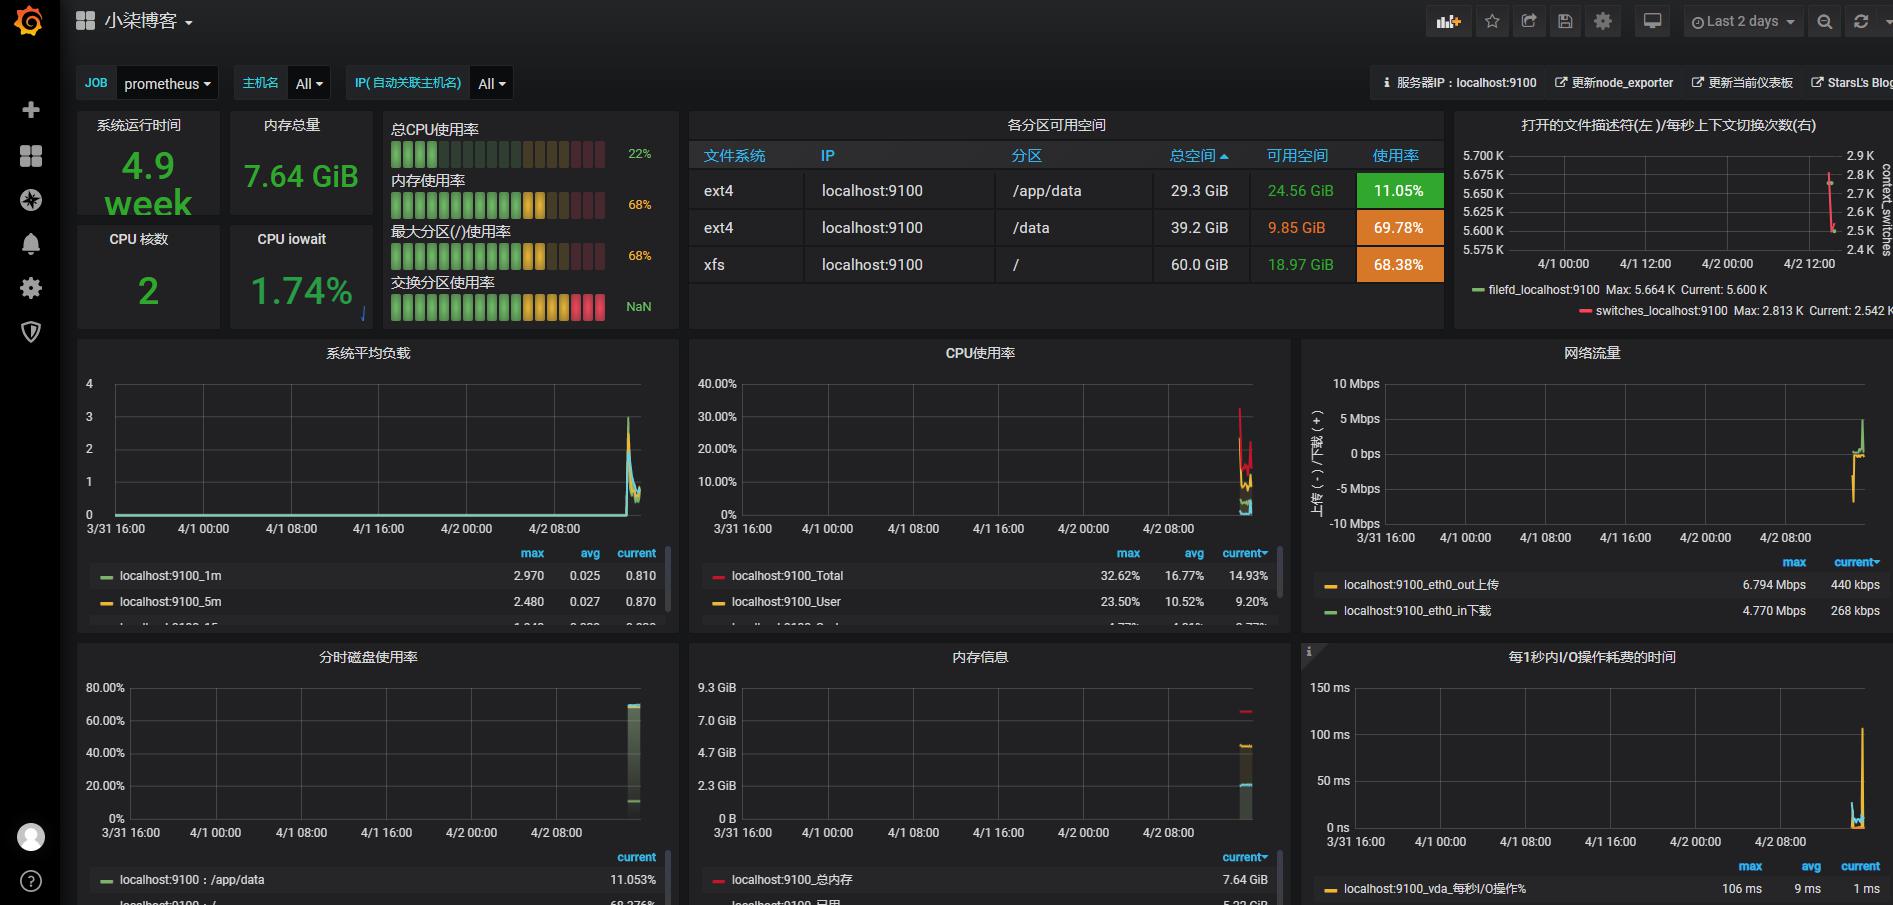
3)效果图:
至此,Prometheus+Grafana监控平台搭建完成。
继续阅读
历史上的今天
4 月
2
- 2023Prometheus开启热加载功能 Prometheus最后更新:2022-12-6
 51工具盒子