英文:
Jmeter - throughput is lower than total transaction per second
问题 {#heading}
I need an advice here. I'm running a performance test using Jmeter. I added Aggregate Report listener and see under throughput value is 8.2/sec.
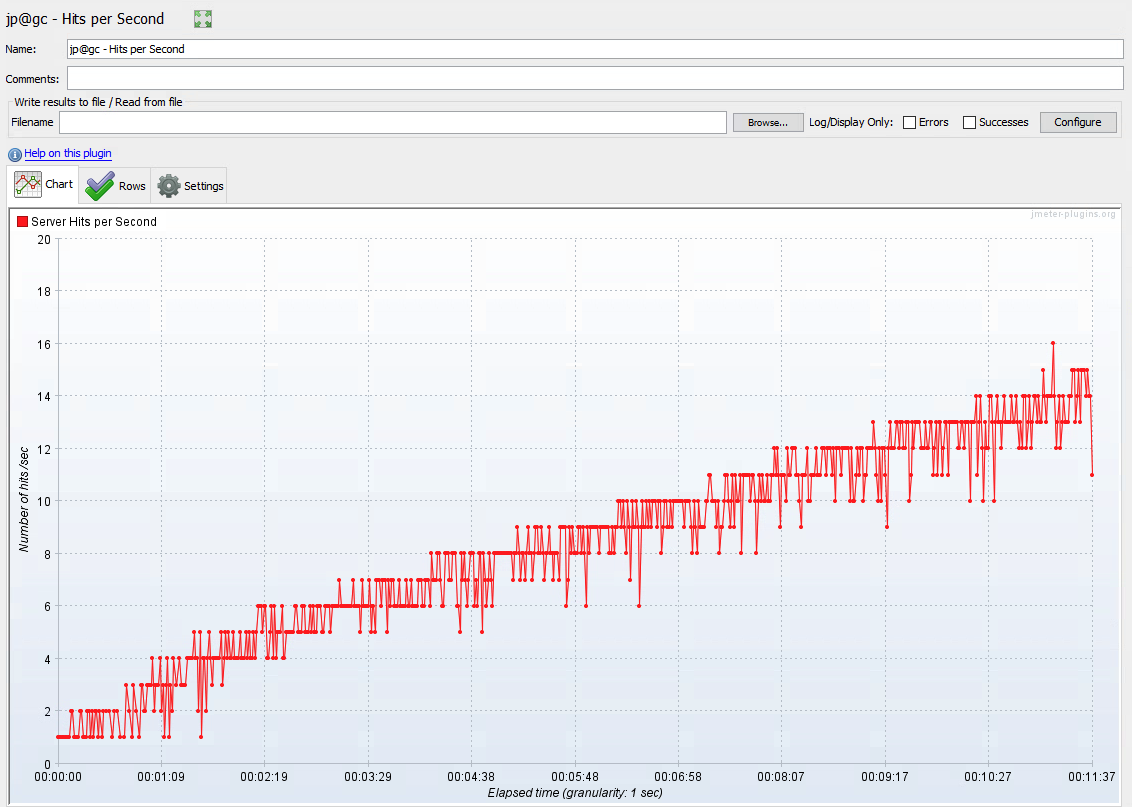
But my actual Hits per second is higher than that using a "Hits per second" listener.
Also, when I generate a report after test run I see "Total Transactions Per Second" graph almost matches to "Hits per second" listener but not a throughput from Aggregate report.
Questions why my throughput value does not match to "Total Transactions Per Second"? Is Throughput measures something different here? Can I generate a graph that will represent a "throughput" values from Aggregate report?
According to Apache doc:
- Throughput - the Throughput is measured in requests per second/minute/hour. The time unit is chosen so that the displayed rate is at least 1.0. When the throughput is saved to a CSV file, it is expressed in requests/second, i.e. 30.0 requests/minute is saved as 0.5.
英文:
<br>I need an advice here. I'm running a performance test using Jmeter. I added Aggregate Report listener and see under throughput value is 8.2/sec.

<br><br>But my actual Hits per second is higher than that using a "Hits per second" listener.

Also, when I generate a report after test run I see "Total Transactions Per Second" graph almost matches to "Hits per second" listener but not a throughput from Aggregate report.

<br> Questions why my throughput value does not match to "Total Transactions Per Second"? Is Throughput measures something different here? Can I generate a graph that will represent a "throughput" values from Aggregate report?
According to Apache doc:
- Throughput - the Throughput is measured in requests per second/minute/hour. The time unit is chosen so that the displayed rate is at least 1.0. When the throughput is saved to a CSV file, it is expressed in requests/second, i.e. 30.0 requests/minute is saved as 0.5.
<br>Any help appreciated. Thanks all!
答案1 {#1}
得分: 1
-
"jp@gc - Hits per Second"不是JMeter的一部分,如果您想了解它如何计算该指标,您需要查看其源代码或联系插件开发人员和/或维护者。
-
您的测试运行时间为10秒,报告粒度设置为1分钟
您试图与之比较图表的插件使用1秒的粒度,因此如果您想要相关联的图表,您应该增加插件的粒度或减小JMeter的HTML报告仪表板粒度。后者可以通过操纵
jmeter.reportgenerator.overall_granularityJMeter属性来完成,有关JMeter属性以及设置和/或覆盖它们的方法的更多信息,请参阅Apache JMeter Properties Customization Guide文章。
英文:
-
"jp@gc - Hits per Second" is not a part of JMeter, if you want an explanation how does it calculate the metric you need to inspect its source code or contact plugin developers and/or maintainers.
-
Your test runs for 10 seconds and your reporting granularity is set to 1 minute
the plugin you're trying to compare the chart with uses granularity of 1 second so if you want to correlate the charts you should either increase the plugin's granularity of decrease JMeter's HTML Reporting Dashboard granularity. The latter can be done by manipulating
jmeter.reportgenerator.overall_granularityJMeter property, see Apache JMeter Properties Customization Guide article for more information on JMeter Properties and the ways of setting and/or overriding them
 51工具盒子


